How to Read a Cyclone Track Map and the Cone of Uncertainty
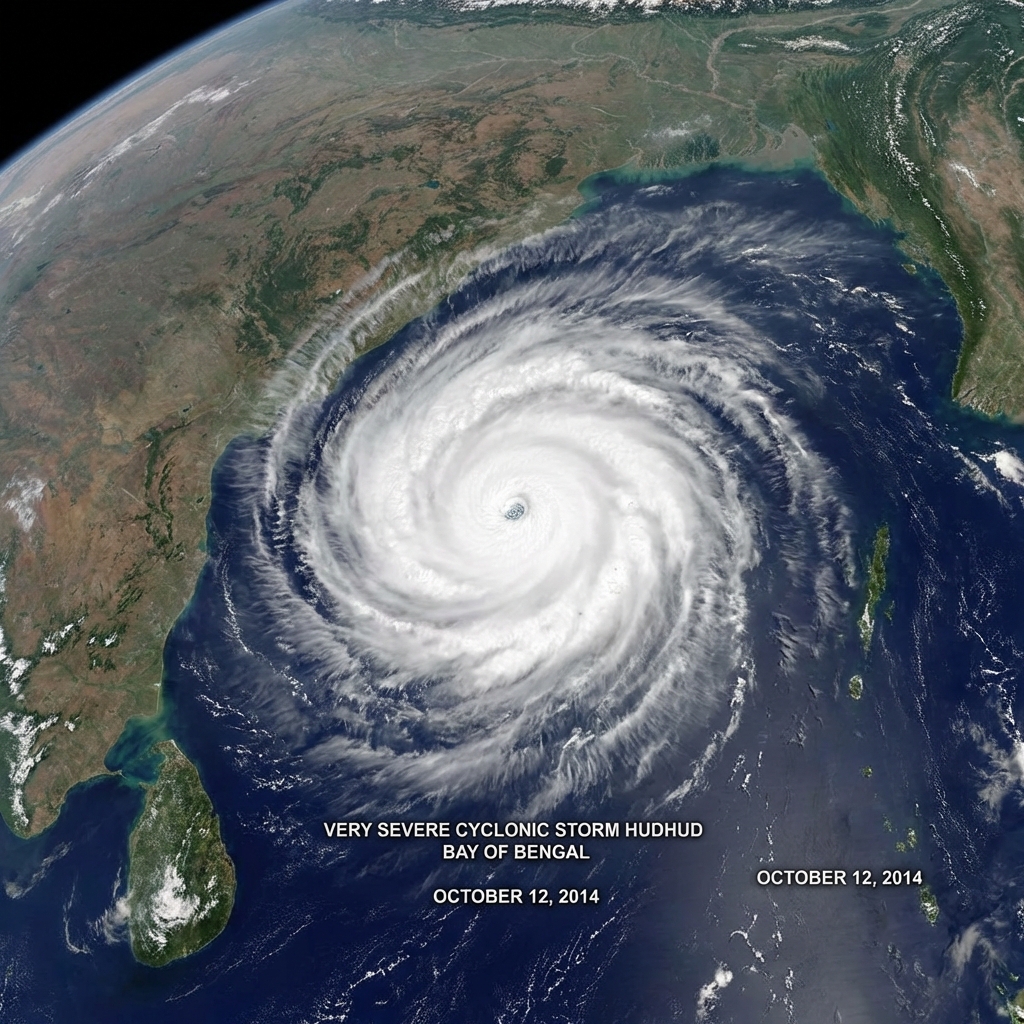
When a cyclone forms in the Bay of Bengal or the Arabian Sea, the image everyone shares is the forecast track map: a line of dots crossing the sea towards the coast, wrapped in a shaded cone. It is one of the most useful tools for understanding a storm, and one of the most misunderstood.
This guide shows you how to read an IMD track map step by step, so you can understand what a storm is likely to do and, just as important, what the map does not tell you.
Where to Find the Official Track Map
The India Meteorological Department (IMD) publishes forecast track maps with each cyclone bulletin on its cyclone page and on the RSMC New Delhi website. During an active storm, bulletins are updated every few hours, and every 3 hours as the storm nears the coast. Always check that you are looking at the latest one.
The Parts of a Track Map
1. The Observed Track (Past Positions)
A line of symbols showing where the centre of the storm has already been, usually marked every 6 or 12 hours. This tells you how fast the storm has been moving and whether it has been turning.
2. The Current Position
The storm's centre at the time of the bulletin, given in latitude and longitude, for example "near 15.2°N, 85.6°E". Bulletins also describe it in words: "about 420 km southeast of Visakhapatnam". This is often the easiest way to understand how far away the storm is.
3. The Forecast Track (Future Positions)
Dots or symbols at forecast times, typically 6, 12, 24, 36, 48, 72, 96 and 120 hours ahead. Each point shows where the centre is expected to be at that time. The spacing tells you the expected speed: points close together mean a slow storm, and slow storms dump more rain and keep strong winds over an area for longer.
4. The Symbols and Colours
Each point is drawn with a symbol or colour that shows the expected intensity at that time, using IMD's scale:
| Code | Category | Sustained wind |
|---|---|---|
| D | Depression | 31-49 km/h |
| DD | Deep Depression | 50-61 km/h |
| CS | Cyclonic Storm | 62-88 km/h |
| SCS | Severe Cyclonic Storm | 89-117 km/h |
| VSCS | Very Severe Cyclonic Storm | 118-166 km/h |
| ESCS | Extremely Severe Cyclonic Storm | 167-221 km/h |
| SuCS | Super Cyclonic Storm | 222 km/h and above |
Read the codes along the track and you can see the whole forecast story: for example, a storm expected to strengthen from CS to VSCS over the sea, then weaken to a DD after crossing the coast. Our guide How IMD Classifies Cyclones explains each category.
5. The Cone of Uncertainty
The shaded area around the forecast track. This is the part most people misread, so it gets its own section below.
6. Date and Time Labels
Times on IMD maps and technical bulletins are often given in UTC (also written as Z or GMT). Indian Standard Time is UTC + 5 hours 30 minutes. So "0000 UTC" is 5:30 am IST, and "1200 UTC" is 5:30 pm IST. Getting this wrong can make you think landfall is hours later than it really is.
Understanding the Cone of Uncertainty
No forecast is perfect. The cone shows how far the storm's centre might be from the forecast line at each time. It is built from the size of IMD's forecast errors in recent years, so it is narrow near the present and gets wider further into the future.
What the Cone Means
- The centre of the storm is likely to stay inside the cone. It usually does, but not always.
- Anywhere inside the cone could see the centre pass over or very close by.
- A wide cone means the track is uncertain. As the storm approaches, the cone shrinks and the forecast becomes more precise.
What the Cone Does Not Mean
- It is not the size of the storm. A cyclone's strong winds, rain bands and surge can extend 100-300 km or more from its centre.
- It is not the danger zone. Areas outside the cone can be hit hard by rain, wind and surge.
- The middle line is not certain. Do not relax because the line is forecast to cross the coast 100 km away. That is well within normal forecast error 2-3 days ahead.
How Accurate Are Track Forecasts?
IMD's forecasts have improved dramatically since the 1999 Odisha Super Cyclone, thanks to satellites, coastal Doppler radars and better computer models. In recent years, average track errors have been roughly:
| Forecast lead time | Typical average track error |
|---|---|
| 24 hours | About 60-80 km |
| 48 hours | About 100-130 km |
| 72 hours | About 150-180 km |
These are averages. Some storms are much easier to forecast than others, and storms that slow down, stall or turn sharply are the hardest.
The Dangerous Right Side
The map shows a single line, but a cyclone is not the same on all sides. In the Northern Hemisphere, cyclones spin anticlockwise. On the right side of the track (looking in the direction the storm is moving), the storm's spinning winds add to its forward speed. That side usually has:
- The strongest winds
- The highest storm surge, because winds push the sea onshore
For a storm moving northwest towards Andhra Pradesh or Odisha, the right side is the coast to the north and northeast of the landfall point. For a storm moving north towards Gujarat, it is the area to the east. If you live just to the right of the forecast landfall point, take the warning especially seriously. Read more in Storm Surge Explained.
Reading a Bulletin Alongside the Map
The map and the text bulletin go together. A typical IMD bulletin line reads like this:
"The Severe Cyclonic Storm over westcentral Bay of Bengal moved northwestwards with a speed of 12 km/h during the past 6 hours and lay centred at 0830 hours IST near latitude 15.8°N and longitude 83.5°E, about 260 km east-southeast of Kakinada. It is very likely to intensify further and cross the Andhra Pradesh coast between Machilipatnam and Kakinada around evening of tomorrow as a Very Severe Cyclonic Storm with maximum sustained wind speed of 120-130 km/h gusting to 145 km/h."
From this one sentence you get the current category, direction and speed of movement, position, distance from a known town, expected intensity at landfall, the stretch of coast where landfall is likely, the timing, and the wind speed. Note that IMD names a stretch of coast between two places. That stretch reflects the uncertainty, just like the cone.
Common Mistakes People Make
- Watching only the line: the storm can cross anywhere in the cone, and its effects reach far beyond it.
- Using an old map: tracks change. A map shared on WhatsApp may be a day old.
- Mixing up time zones: UTC is 5 hours 30 minutes behind IST.
- Treating model maps as forecasts: apps showing raw computer model runs are not official forecasts. See IMD vs JTWC.
- Ignoring rain after landfall: the track continues inland, and a weakening depression can still cause severe flooding hundreds of kilometres from the coast.
Key Points to Remember
- Dots show where the centre will be, and codes show how strong it will be.
- The cone shows where the centre may go, not how big the storm is.
- The right side of the track usually brings the worst wind and surge.
- Always use the latest official IMD bulletin and convert UTC to IST.
Put it into practice: follow the current system on our Active Systems page and the latest bulletins.
Indian Cyclones is an independent explainer, not an official warning service. Always follow IMD and your district administration.